OEE works by assigning a numerical value to improvement opportunities. It factors in the availability, performance, and output quality of any piece of equipment and tells management how they can best utilize their capacity – while also eliminating “bottlenecks” (constraints) that can harm the factory’s production and locating improvements that could increase production.
When you consider this, it’s easy to see the importance of OEE – after all, what company wouldn’t want to stay on top of metrics like performance, quality, and machine availability? When a machine is bottlenecking a process with low OEE, the overall throughput of the factory is down. By increasing the OEE of the bottleneck, a factory can significantly increase throughput and, in consequence, produce more with the same resources and assets. Here are six significant losses that can help operators understand the reasons behind a decrease in OEE.
Availability loss
- Equipment failure. Equipment failures can be divided into two types – occasional and chronic. Occasional failures usually come about due to unusual symptoms of machine functionality, while chronic failures are regular issues, triggered by incorrect machine use or repeatable failures caused by the machine itself. The cost of equipment failure is an availability loss – if the machine is not operating, it loses availability and is unable to produce, which means losses for the company.
- Setup and adjustments. This covers multiple categories, including production downtime due to changeovers, machine, and tooling adjustments, planned maintenance, inspections, and setup/startup time. The ideal here is the SMED (Single-Minute Exchange of Dies) theory, which can dramatically reduce changeover times (in many cases to less than 10 minutes) by analyzing each element of a changeover to see if it can be eliminated, moved, simplified, or streamlined.
Performance loss
- Idling and minor stops. These can be caused by jams, flow obstructions, wrong settings, or cleaning, and are usually resolved by the operator. This loss is rarely registered and often doesn’t gather much attention, mainly because the downtimes are typically short. A common practice is to count the number of micro-stoppages rather than summarize their time, giving operators and supervisors a picture of a potential improvement’s impact.
- Reduced speed. Often referred to as slow cycles, reduced speed happens when equipment runs slower than the ideal cycle time. It’s typically caused by worn out or poorly maintained equipment, substandard or missing materials, and bad environmental conditions.
Quality loss
- Process defects. This refers to any defective part manufactured during stable production, including junked parts and parts that can be reworked. Incorrect machine settings and operator or equipment errors are common reasons for process defects.
- Reduced yield. This covers defective parts made from startup until stable production is achieved. Like process defects, it can mean scrapped parts and parts that can be reworked. Reduced yield most commonly occurs after changeovers and during machine warmups, but incorrect settings are a common culprit as well. A widespread mistake is not distinguishing the two categories (process and startup defects) – often, startup defects are not registered.
Formulas
After seeing what companies stand to lose by not implementing OEE, nobody should need to be sold on its importance. To calculate OEE, manufacturers typically use the following formulas:
The Availability factor is the amount of time (expressed in percentages) available for the production tasks reduced by availability loss (events that prevent production) such as breakdowns, maintenance, and updates. The formula is as follows:

The Performance factor shows the number of goods produced while the machine was running compared to the number of products that should have been produced under optimal operating conditions:

The Quality factor describes the quality percentage of the produced goods. It can be calculated by taking produced goods, subtracting scraps and reworks, dividing by the produced goods, and multiplying by 100%.

Examples
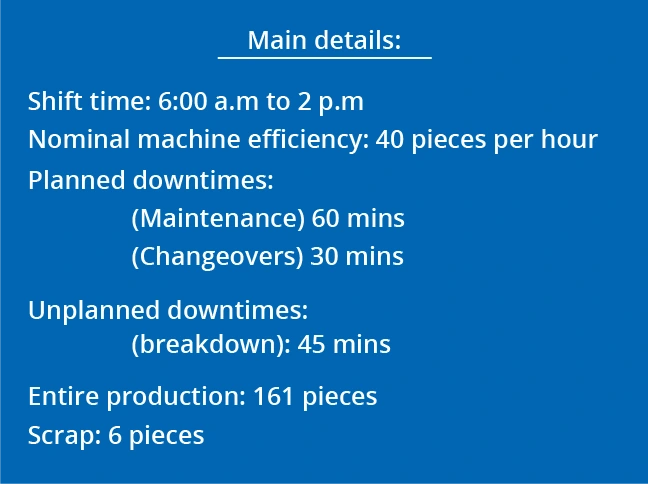

Availability = 72% (there was a breakdown of the machine, a changeover occurred during the shift and the machine underwent maintenance)

Performance = 70% (the machine probably gets blocked or stuck rather often, or the speed was set to a lower level than suggested)

Quality = 96% (there were 6 faulty products)
Overall the calculation method is: OEE = 72% x 70% x 96% = 48%
The result of 48% states that the machines produce less than half of the products that could potentially be produced under ideal conditions. For comparison purposes, the world’s leading manufacturers regularly achieve OEE at a level of 85% or more.
Availability (90%) x Performance (95%) x Quality (99%) = 85% OEE
Variations in OEE calculation
Many companies deviate from the above described method when calculating their OEE. The most common error is not including preventive maintenance activities when calculating the Availability loss. Often, the speed used for performance calculation is not the optimal speed suggested by the manufacturer or determined through experience but a typical average speed. Finally, sometimes the Quality factor is not used in the equation.
It’s also important to remember that classical OEE does not measure machine utilization. OEE is only calculated when a machine is scheduled to run and does not take into account time when the machine is not needed for lack of demand, such as during weekends or on odd shifts. Therefore it does not include losses caused by the company’s strategic decisions or changes in the marketplace.
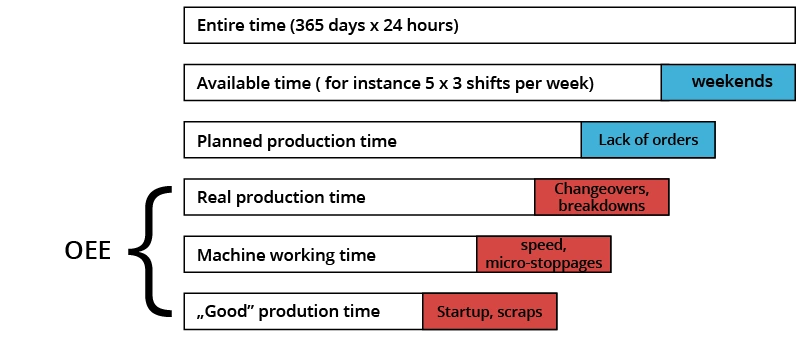
* real production time = time when machine is working
** machine working time = time when machine is producing
*** Good production time = time when the machine produces good quality product
However some companies occasionally facilitate OEE2 to show available capacity. This is calculated by multiplying OEE times the loading factor. A machine with 80% OEE but running only one shift will have OEE2 on the level of 19% (80% x 40 hrs /168 hrs in a week). While this number may help make one off investment decisions, following it on a regular basis makes little sense since variations in it may come from independent factors: market behavior or process neglect/improvement.
OEE Analysis
The level of OEE is important, but perhaps more important is the constant elimination of losses. Therefore, it is not recommended to jump to conclusions after one day or even a week of data, as an analysis of a longer period of time is essential to understanding machine behavior.

Which machine is “better”, A or B?
OEE monitoring can make significant improvements possible simply by showing actual results to employees. Several companies install monitors on the shop floor for precisely this reason –
when workers see that the results of their labor are out in the open for all to see, they are motivated to improve the indicators.

Additionally, monitoring individual components of OEE allows company management to properly allocate resources for continuous improvement activities. If Availability is low, a company most likely needs to reduce changeover times using SMED methodology or the breakdown rate by implementing TPM. If Performance is below target, in an automated environment micro-stops are usually the culprit and targeted problem-solving activities should be started. Finally, if product quality is not satisfactory, problem-solving or Six Sigma application maybe warranted.
Charts below show actual examples from a variety of industries.

Here is an example from a process manufacturer in the building materials industry. An increase in OEE was achieved by applying 5S and TPM, including autonomous and preventive maintenance.

Here we have an example from the cosmetics industry. OEE on packing lines was essentially doubled over the space of two years by reducing changeover times (SMED) and applying basic housekeeping principles. Part of the increase was also due to a reduction in micro-stops by targeted problem-solving activities.

And finally, we have an OEE graph from a construction materials manufacturer. Significant week to week variations in the chart are the result of a varying product mix and not always optimal production sequence. However, the trendline shows a positive development achieved after operators were simply asked to record stop causes and times by hand.
Conclusions
When it is implemented wisely, OEE allows manufacturers to reduce downtime, increase capacity, lower costs, improve quality, and increase efficiency. It is important to remember that implementing OEE is not an endgame – it’s just one more tool in the tool chest, a starting point toward overall process excellence. OEE shows a manufacturer how good they are and allows them to track the influence of all improvements over time. The final effect comes from measuring OEE, analyzing areas that require focus, implementing improvements, and checking the impact of those improvements. As with any other tool, the final success or failure is not the province of the OEE software, but rather that of the manufacturer implementing it.

Lean Vision for over 20 years has been helping companies around the world to implement Lean Management philosophy and improve productivity, quality, reduce costs and increase safety. Experience covers many industries, including automotive, food, pharmaceutical, chemical, paper, electronics, heavy industry, construction, as well as government, services and healthcare.
